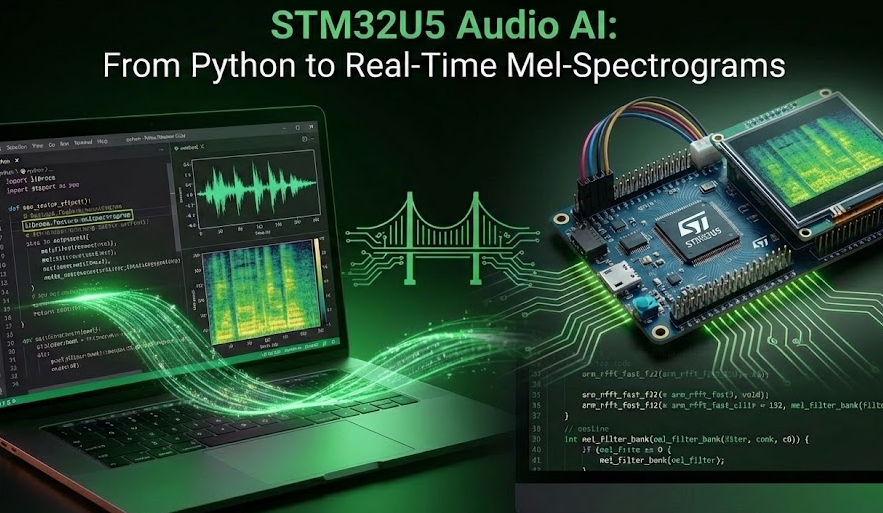
AI prep tutorial: Audio Project on STM32
Summary
This guide bridges the gap between high-level Python audio processing and efficient C implementation for the STM32U5. We explore the transition from raw audio data to normalized Mel-spectrograms, providing the specific code needed to stream these features to a PC for live visualization and mathematical validation.
Abstract
Feature extraction is the most critical stage of an embedded AI pipeline. For audio, the Mel-spectrogram serves as a 2D “image” of sound that Convolutional Neural Networks (CNNs) can digest. While Python’s librosa or tensorflow handles this in one line, microcontrollers require a manual chain of windowing, FFTs, and Mel-scale binning.
1. Introduction
The STM32U5 series represents a massive leap for embedded audio. Previously, generating a complex Mel-spectrogram in real-time could consume 30-50% of an MCU’s clock cycles. Now, we can offload the heavy lifting, its even better with STM32N6. To ensure our keyword spotting or sound classification model works, we must ensure the STM32’s DSP pipeline perfectly mirrors our training code.
2. Prerequisites
Hardware:
- STM32 Nucleo or Discovery Board.
- STM32U5 IOT board is the preferred board here.
Software:
- STM32CubeIDE: The all-in-one development tool for STM32.
- STM32CubeMX: With the X-CUBE-AI expansion pack installed.
- Google Colab: For training the model in the cloud without local setup.
3. What is a Mel-Spectrogram
A Mel-spectrogram is a visual representation of sound where the frequency axis is warped to match human hearing (the Mel scale).
STFT: We take a signal, slice it into overlapping windows, and apply a Fast Fourier Transform (FFT) to each.
Magnitude: We take the absolute value of the complex FFT output.
Mel-Scale: We group the frequency bins into “banks” (e.g., 32 or 64 filters) that are closer together at low frequencies and wider at high frequencies, mimicking how our ears perceive pitch.
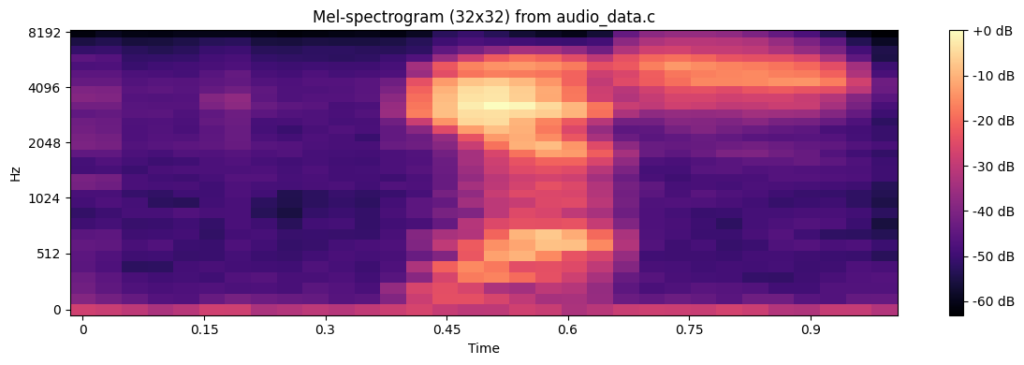
A visual representation of the audio “yes” from a wav file transformed into mel-scale is shown below:
4. How Audio Works on Embedded Systems
Audio capture starts with a PDM (Pulse Density Modulation) MEMS microphone.
The Hardware: PDM is a high-speed 1-bit stream. The STM32’s MDF (Multi-function Digital Filter) peripheral acts as a dedicated hardware decimation engine.
Conversion: The MDF filters and down-samples the PDM stream (e.g., from 1.024 MHz) to 16-bit PCM (Pulse Code Modulation) at 16 kHz or many other frequencies (32, 48, 192, etc.)
The Buffer: Samples are typically moved via DMA into a 1-second (16,000 samples) buffer ready for the DSP function to convert it.
5. How to Evaluate Audio with Mel-Spectrograms
To verify your C-code, you should compare the matrix values from your STM32 against your Python training data. Even small differences in windowing (Hann vs. Rectangular) or normalization (Log-scale) can drop AI accuracy from 98% to 20%. The “Hardware-in-the-Loop” method provided below allows you to see what the NPU sees in real-time.
Step 1: Python – Converting a WAV to a C Header
This article will not cover how to configure the live microphone, we’ll use a fixed WAV sample to verify our math.
There are several possible approaches, the two most common would be to either use the librosa to get the images and overall content and it is actually quite simple:
					import librosa
import numpy as np

# Load 1s sample from Mini-Speech Commands
audio, sr = librosa.load('004ae714_nohash_0.wav', sr=16000, duration=1.0)
# Convert to signed 16-bit PCM
audio_int16 = (audio * 32767).astype(np.int16)

with open("audio_sample.h", "w") as f:
   f.write("#include <stdint.h>\n")
   f.write("const int16_t audio_sample_16k[16000] = {\n")
   f.write(", ".join(map(str, audio_int16)))
   f.write("\n};")
The wav file comes from the the mini_speech dataset, that can be download from:
http://storage.googleapis.com/download.tensorflow.org/data/mini_speech_commands.zip
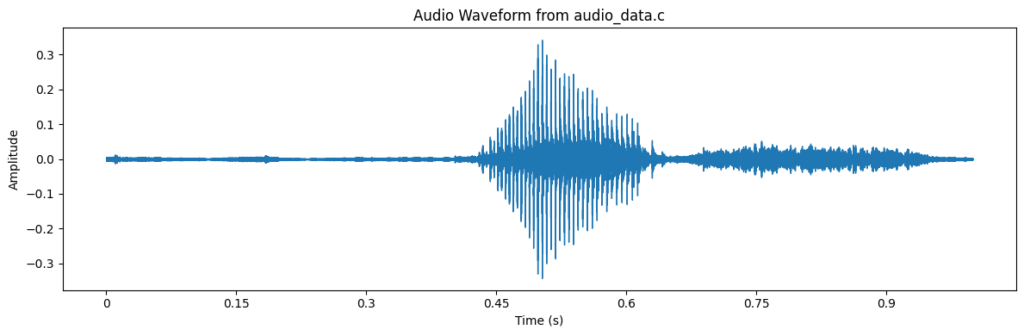
The plot can be easily made using the following code:
					import matplotlib.pyplot as plt
import librosa.display

plt.figure(figsize=(12, 4))
librosa.display.waveshow(audio, sr=sr)
plt.title('Audio Waveform')
plt.xlabel('Time (s)')
plt.ylabel('Amplitude')
plt.tight_layout()
plt.show()
And the mel-spectogram with this:
					import librosa
import librosa.display
import matplotlib.pyplot as plt
import numpy as np

# Compute the Mel-spectrogram with adjusted parameters for a 32x32 feature map
# n_mels=32 for 32 frequency bins
# hop_length calculated to get 32 time frames for 16000 samples: floor(16000 / 516) + 1 = 31 + 1 = 32
mel_spectrogram = librosa.feature.melspectrogram(y=audio, sr=sr, n_mels=32, hop_length=516)
mel_spectrogram_db = librosa.power_to_db(mel_spectrogram, ref=np.max)

print(f"Shape of the Mel-spectrogram: {mel_spectrogram.shape}")

plt.figure(figsize=(12, 4))
librosa.display.specshow(mel_spectrogram_db, sr=sr, x_axis='time', y_axis='mel')
plt.colorbar(format='%+2.0f dB')
plt.title('Mel-spectrogram (32x32)')
plt.tight_layout()
plt.show()
OR, we as the objective is check if our STM32 can really implement the mel-spectogram, we can use the same wav file used on the python along with the script provided in this article> https://hackerembedded.com/how-to-build-a-simple-audio-player-with-stm32/, to transform the wav into a c vector without any library help.
					import struct

input_wav = "004ae714_nohash_0.wav"
output_c = "audio_data.c"

def wav_to_c_array(infile, outfile):
   with open(infile, "rb") as f:
       # Skip the 44-byte WAV header to get raw PCM data
       f.seek(44)
       data = f.read()

   # Convert binary bytes to 16-bit signed integers (Little Endian)
   samples = struct.unpack(f'<{len(data)//2}h', data)

   with open(outfile, "w") as f:
       f.write('#include <stdint.h>\n\n')
       # Use 'const' to ensure the data stays in Flash and doesn't consume RAM
       f.write('const int16_t audio_samples_16k[] = {\n    ')

       for i, sample in enumerate(samples):
           f.write(f"{sample}, ")
           if (i + 1) % 12 == 0:  # New line every 12 samples for readability
               f.write("\n    ")

       f.write('\n};\n\n')
       f.write(f'const uint32_t audio_samples_count = {len(samples)};\n')

wav_to_c_array(input_wav, output_c)
print(f"Generated {output_c}")
Now, with the generated C file, that can be used with the STM32 side, simply change it to be usable in python:
					import numpy as np

audio_samples_16k = np.array([
   -91, -176, -111, -95, -120, -151, -133, -133, -131, -122, -159, -148, ...
], dtype=np.int16)

audio_samples_count = 16000
To plot the mel spectogram, we can use this simple code:
mport numpy as np
import matplotlib.pyplot as plt
#from audio_data import audio_samples_16k, audio_samples_count
SAMPLE_RATE = 16000.0
NUM_SAMPLES = audio_samples_count
FFT_SIZE = 512
FRAME_LENGTH = FFT_SIZE
HOP_LENGTH = 256
NUM_FRAMES = 32
NUM_MEL_BANDS = 32
F_MIN = 0.0
F_MAX = SAMPLE_RATE * 0.5
EPSILON = 1e-10
def hz_to_mel(hz: float) -> float:
return 2595.0 * np.log10(1.0 + hz / 700.0)
def mel_to_hz(mel: float) -> float:
return 700.0 * (10.0 ** (mel / 2595.0) - 1.0)
def init_hann_window():
n = np.arange(FRAME_LENGTH, dtype=np.float32)
return 0.5 - 0.5 * np.cos(2.0 * np.pi * n / (FRAME_LENGTH - 1))
def init_mel_filter_bank():
num_fft_bins = FFT_SIZE // 2 + 1
fft_bin_width = SAMPLE_RATE / FFT_SIZE
mel_min = hz_to_mel(F_MIN)
mel_max = hz_to_mel(F_MAX)
mel_points = np.zeros(NUM_MEL_BANDS + 2, dtype=np.float32)
for m in range(NUM_MEL_BANDS + 2):
mel_points[m] = mel_min + (m / (NUM_MEL_BANDS + 1.0)) * (mel_max - mel_min)
hz_points = np.zeros(NUM_MEL_BANDS + 2, dtype=np.float32)
bin_idx = np.zeros(NUM_MEL_BANDS + 2, dtype=np.int32)
for m in range(NUM_MEL_BANDS + 2):
hz_points[m] = mel_to_hz(mel_points[m])
bin_f = hz_points[m] / fft_bin_width
b = int(np.floor(bin_f + 0.5)) # nearest bin (same as C)
if b >= num_fft_bins:
b = num_fft_bins - 1
bin_idx[m] = b
mel_filter_bank = np.zeros((NUM_MEL_BANDS, num_fft_bins), dtype=np.float32)
for m in range(1, NUM_MEL_BANDS + 1):
f_m_minus = bin_idx[m - 1]
f_m = bin_idx[m]
f_m_plus = bin_idx[m + 1]
# Rising edge
for k in range(f_m_minus, f_m):
mel_filter_bank[m - 1, k] = (k - f_m_minus) / ((f_m - f_m_minus) + 1e-9)
# Falling edge
for k in range(f_m, min(f_m_plus + 1, num_fft_bins)):
mel_filter_bank[m - 1, k] = (f_m_plus - k) / ((f_m_plus - f_m) + 1e-9)
return mel_filter_bank
def compute_mel_matrix_same_as_mcu():
audio_f = audio_samples_16k.astype(np.float32) / 32768.0
hann_window = init_hann_window()
mel_filter_bank = init_mel_filter_bank()
num_fft_bins = FFT_SIZE // 2 + 1
# Internal layout is identical to STM32: [time][mel]
mel_spectrogram = np.zeros((NUM_FRAMES, NUM_MEL_BANDS), dtype=np.float32)
for frame in range(NUM_FRAMES):
start_idx = frame * HOP_LENGTH
frame_buf = np.zeros(FRAME_LENGTH, dtype=np.float32)
for n in range(FRAME_LENGTH):
idx = start_idx + n
if 0 <= idx < NUM_SAMPLES:
frame_buf[n] = audio_f[idx]
else:
frame_buf[n] = 0.0
frame_buf *= hann_window
# Real FFT (same length 512, output 257 bins)
spectrum = np.fft.rfft(frame_buf, n=FFT_SIZE)
# Power spectrum |X(k)|^2, k in [0, 256]
power_spectrum = (np.real(spectrum) ** 2 + np.imag(spectrum) ** 2).astype(np.float32)
# Mel energies H[m] @ power_spectrum
mel_energies = mel_filter_bank @ power_spectrum
# log10 compression, with EPSILON
mel_energies = np.maximum(mel_energies, EPSILON)
mel_spectrogram[frame, :] = np.log10(mel_energies)
# Global normalization exactly as in C
min_val = np.min(mel_spectrogram)
max_val = np.max(mel_spectrogram)
range_val = max_val - min_val
if range_val < 1e-9:
range_val = 1.0
mel_spectrogram_norm = (mel_spectrogram - min_val) / range_val
# MCU UART image layout: row = mel, col = time
mel_image_hz_time = mel_spectrogram_norm.T # shape (32, 32)
return mel_image_hz_time
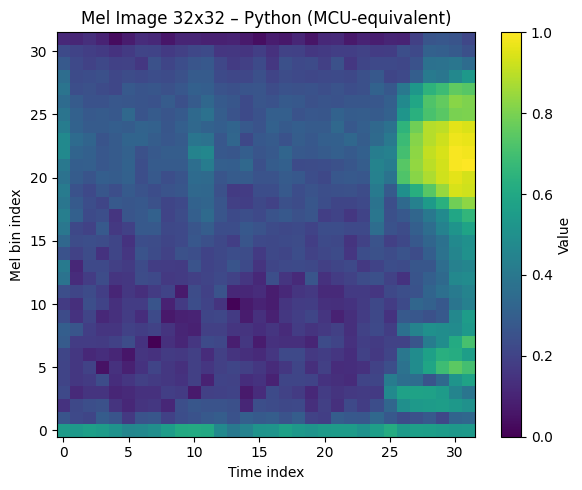
def main():
mel_img = compute_mel_matrix_same_as_mcu() # [mel, time]
plt.figure(figsize=(6, 5))
plt.imshow(
mel_img,
origin="lower", # mel 0 at bottom if you like; set 'upper' if MCU viewer uses that
aspect="auto",
interpolation="nearest",
)
plt.colorbar(label="Value")
plt.xlabel("Time index")
plt.ylabel("Mel bin index")
plt.title("Mel Image 32x32 – Python (MCU‑equivalent)")
plt.tight_layout()
plt.show()
if __name__ == "__main__":
main()
The plot would be basically the same, might be transposed when using librosa:
Both audio_data.c and audio_sample.h aim to convert the audio from the WAV file into a C-style array of int16_t samples. However, they use fundamentally different methods, leading to several key distinctions:
Audio Loading and Decoding:
audio_sample.h: Uses librosa.load(), a high-level Python library function. librosa automatically decodes the WAV file, handles the header, and returns the audio as floating-point samples (normalized between -1.0 and 1.0). The code then explicitly converts these floats to int16_t by multiplying by 32767 (the maximum value for a signed 16-bit integer).
audio_data.c: Reads the WAV file as raw binary data. It then explicitly skips the first 44 bytes, assuming these constitute the standard WAV header. After skipping the header, it uses struct.unpack() to directly interpret the subsequent raw binary bytes as signed 16-bit integers (PCM data), assuming the WAV file is already in this format.
Robustness to WAV Format:
audio_sample.h: Relies on librosa to correctly parse and decode the WAV file. If the WAV file isn’t standard 16-bit PCM, librosa handles the conversion.
audio_data.c: Assumes a standard 44-byte WAV header and that the audio data immediately following is raw signed 16-bit PCM (little-endian). This approach is less flexible if the WAV file has a different header size or encoding, but it’s very direct and doesn’t require external audio libraries during the conversion step.
Array Sizing:
audio_sample.h: Defines the array size explicitly as 16000, based on the duration=1.0 and sr=16000 parameters passed to librosa.load(). If the actual audio were shorter or longer, librosa would resample/trim, and the array would still be 16000 samples.
audio_data.c: Calculates audio_samples_count dynamically based on the actual amount of data read from the file after the header. This makes it more adaptable to WAV files of varying lengths.
In essence, audio_sample.h uses a more abstract, library-driven approach to get the audio data into int16 format, while audio_data.c employs a lower-level, direct parsing method suitable for environments where direct file manipulation is preferred or external libraries like librosa are not available.
I’ll use my own script, because all I have to do is normalize my c vector and that is something easy for the STM32, basically it just transforms the buffer into a floating one, ranging from -1 to 1 and that is achieved by dividing the value by 32767.
Step 2: Hands-on STM32U5 – The C Pipeline
We use CMSIS-DSP to transform the audio_sample_16k array into the 32×32 feature map.
Create a simple project with STM32CubeMX for https://www.st.com/en/evaluation-tools/b-u585i-iot02a.html board. Add the USART1 at PA9 and PA10 with 115200/8/N/1.
Once the project is created, make sure to manually add the CMSIS ARM math library. This is available in the repository and has to be manually added. The end result should look like this:
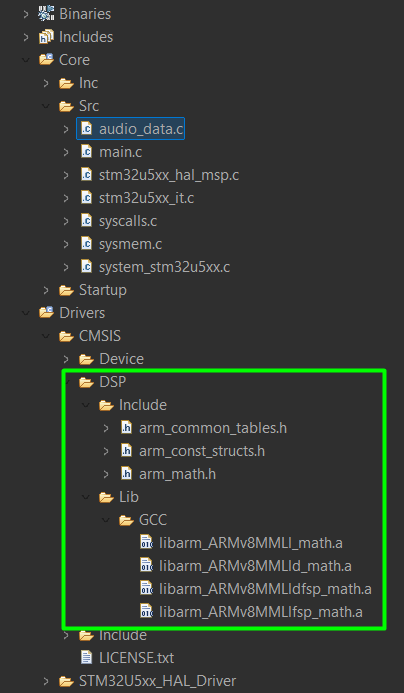
As you can see, the audio_data.c file was also added.
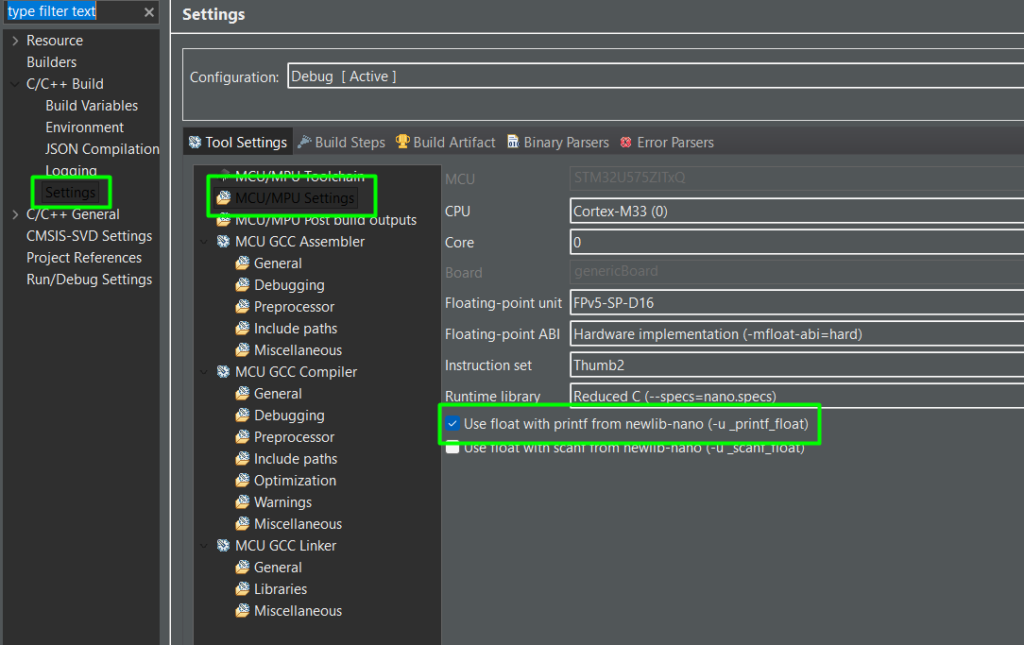
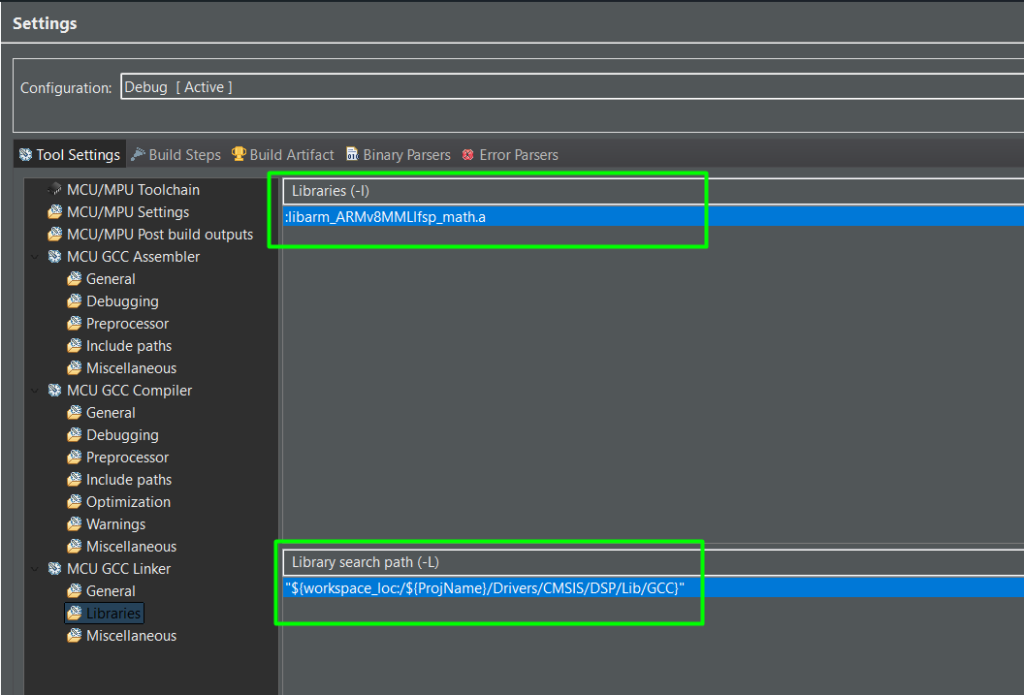
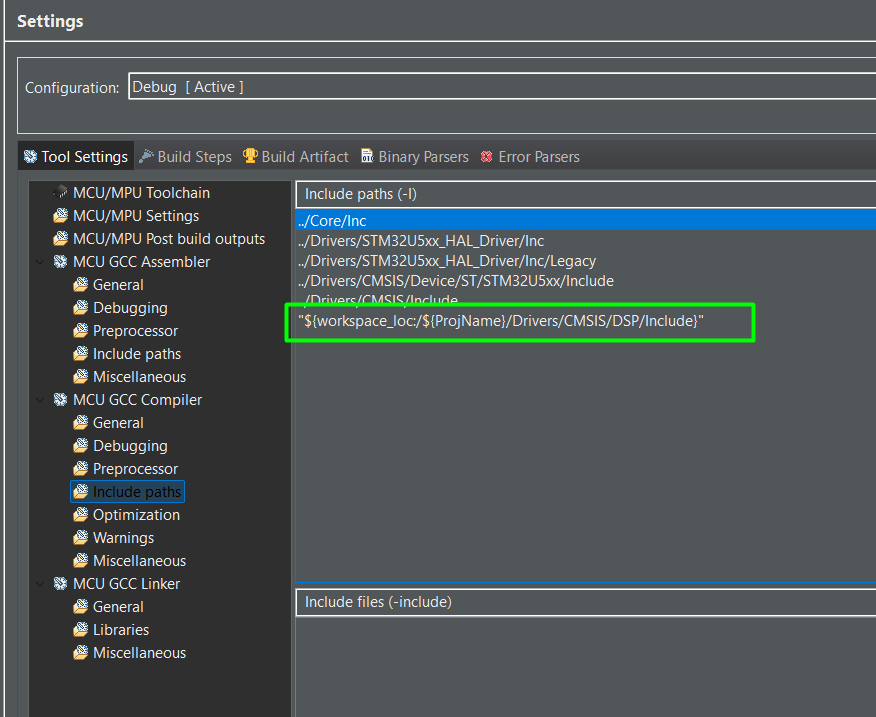
There are few adjustments needed on the project settings, including the printf float support, the library for GCC and the include paths as well:
Step2-1: The DSP Implementation
					* USER CODE BEGIN Header */
/**
 ******************************************************************************
 * @file           : main.c
 * @brief          : Main program body
 ******************************************************************************
 * @attention
 *
 * Copyright (c) 2022 STMicroelectronics.
 * All rights reserved.
 *
 * This software is licensed under terms that can be found in the LICENSE file
 * in the root directory of this software component.
 * If no LICENSE file comes with this software, it is provided AS-IS.
 *
 ******************************************************************************
 */
/* USER CODE END Header */
/* Includes ------------------------------------------------------------------*/
#include "main.h"

/* Private includes ----------------------------------------------------------*/
/* USER CODE BEGIN Includes */
#include "stdio.h"
#include "arm_math.h"
#include <stdint.h>
#include <math.h>
/* USER CODE END Includes */

/* Private typedef -----------------------------------------------------------*/
/* USER CODE BEGIN PTD */

/* USER CODE END PTD */

/* Private define ------------------------------------------------------------*/
/* USER CODE BEGIN PD */
#define SAMPLE_RATE             16000.0f
#define NUM_SAMPLES             16000      // audio_samples_16k length

#define FFT_SIZE                512
#define FRAME_LENGTH            FFT_SIZE   // window length
#define HOP_LENGTH              256
#define NUM_FRAMES              32         // output time steps
#define NUM_MEL_BANDS           32         // output frequency steps

// Mel filter bank limits (in Hz)
#define F_MIN                   0.0f
#define F_MAX                   (SAMPLE_RATE * 0.5f)

// Small value to avoid log(0)
#define EPSILON                 1e-10f
/* USER CODE END PD */

/* Private macro -------------------------------------------------------------*/
/* USER CODE BEGIN PM */

/* USER CODE END PM */

/* Private variables ---------------------------------------------------------*/

UART_HandleTypeDef huart1;

/* USER CODE BEGIN PV */
extern const int16_t audio_samples_16k[];
// Buffers (as before, shortened here)

// Output Mel spectrogram: [time][mel_band]
float32_t mel_spectrogram[NUM_FRAMES][NUM_MEL_BANDS];

// FFT related buffers
static float32_t fft_input[FFT_SIZE];
static float32_t fft_output[FFT_SIZE];          // complex: [re0, im0, re1, im1, ...]
static float32_t power_spectrum[FFT_SIZE / 2 + 1]; // magnitude^2 of positive bins

// Window function
static float32_t hann_window[FRAME_LENGTH];

// Mel filter bank: [NUM_MEL_BANDS][FFT_SIZE/2+1]
static float32_t mel_filter_bank[NUM_MEL_BANDS][FFT_SIZE / 2 + 1];

// CMSIS FFT instance
static arm_rfft_fast_instance_f32 S_rfft;
/* USER CODE END PV */

/* Private function prototypes -----------------------------------------------*/
void SystemClock_Config(void);
static void MX_GPIO_Init(void);
static void MX_USART1_UART_Init(void);
/* USER CODE BEGIN PFP */
int __io_putchar(int ch){
 HAL_UART_Transmit(&huart1, (uint8_t *)&ch, 1, 0xFFFF);
 return ch;
}
/* USER CODE END PFP */

/* Private user code ---------------------------------------------------------*/
/* USER CODE BEGIN 0 */
// ------------------------ Helpers (window, mel bank) ------------------------
// Convert frequency (Hz) to Mel
static float32_t hz_to_mel(float32_t hz)
{
   return 2595.0f * log10f(1.0f + hz / 700.0f);
}

// Convert Mel to frequency (Hz)
static float32_t mel_to_hz(float32_t mel)
{
   return 700.0f * (powf(10.0f, mel / 2595.0f) - 1.0f);
}

// Initialize Hann window
static void init_hann_window(void)
{
   for (uint32_t n = 0; n < FRAME_LENGTH; n++)
   {
       hann_window[n] = 0.5f - 0.5f * cosf(2.0f * PI * (float32_t)n / (FRAME_LENGTH - 1));
   }
}

// Initialize Mel filter bank
static void init_mel_filter_bank(void)
{
   const uint32_t num_fft_bins = FFT_SIZE / 2 + 1;
   const float32_t fft_bin_width = SAMPLE_RATE / (float32_t)FFT_SIZE;

   // Compute Mel points
   float32_t mel_min = hz_to_mel(F_MIN);
   float32_t mel_max = hz_to_mel(F_MAX);

   // We need NUM_MEL_BANDS + 2 points (for triangular filters)
   float32_t mel_points[NUM_MEL_BANDS + 2];
   for (uint32_t m = 0; m < NUM_MEL_BANDS + 2; m++)
   {
       mel_points[m] = mel_min + ((float32_t)m / (NUM_MEL_BANDS + 1)) * (mel_max - mel_min);
   }

   // Convert Mel points to Hz, then to FFT bin indices
   float32_t hz_points[NUM_MEL_BANDS + 2];
   uint32_t bin[NUM_MEL_BANDS + 2];

   for (uint32_t m = 0; m < NUM_MEL_BANDS + 2; m++)
   {
       hz_points[m] = mel_to_hz(mel_points[m]);
       float32_t bin_f = hz_points[m] / fft_bin_width;
       uint32_t b = (uint32_t)floorf(bin_f + 0.5f);   // nearest bin
       if (b >= num_fft_bins)
           b = num_fft_bins - 1;
       bin[m] = b;
   }

   // Zero the filter bank
   for (uint32_t i = 0; i < NUM_MEL_BANDS; i++)
   {
       for (uint32_t j = 0; j < num_fft_bins; j++)
       {
           mel_filter_bank[i][j] = 0.0f;
       }
   }

   // Create triangular filters
   for (uint32_t m = 1; m <= NUM_MEL_BANDS; m++)
   {
       uint32_t f_m_minus = bin[m - 1];
       uint32_t f_m       = bin[m];
       uint32_t f_m_plus  = bin[m + 1];

       // Rising edge
       for (uint32_t k = f_m_minus; k < f_m; k++)
       {
           mel_filter_bank[m - 1][k] =
               (float32_t)(k - f_m_minus) / (float32_t)(f_m - f_m_minus + 1e-9f);
       }

       // Falling edge
       for (uint32_t k = f_m; k <= f_m_plus && k < num_fft_bins; k++)
       {
           mel_filter_bank[m - 1][k] =
               (float32_t)(f_m_plus - k) / (float32_t)(f_m_plus - f_m + 1e-9f);
       }
   }
}


void audio_mel_spectrogram_init(void)
{
   // Initialize FFT
   arm_rfft_fast_init_f32(&S_rfft, FFT_SIZE);

   // Initialize Hann window and Mel filter bank
   init_hann_window();
   init_mel_filter_bank();
}

void compute_log_mel_spectrogram_32x32(void)
{
   const uint32_t num_fft_bins = FFT_SIZE / 2 + 1;

   for (uint32_t frame = 0; frame < NUM_FRAMES; frame++)
   {
       // 1) Compute start index for this frame
       uint32_t start_idx = frame * HOP_LENGTH;

       // Safety: if we are out of range, zero-pad
       for (uint32_t n = 0; n < FRAME_LENGTH; n++)
       {
           int32_t idx = (int32_t)start_idx + (int32_t)n;
           float32_t sample = 0.0f;
           if (idx >= 0 && idx < NUM_SAMPLES)
           {
               // Convert int16 -> float in [-1, 1]
               sample = (float32_t)audio_samples_16k[idx] / 32768.0f;
               //// Replace normalization loop for a moment:
               //    // 1 kHz sine at 16 kHz sample rate
               //    float32_t t = (float32_t)i / (float32_t)SAMPLE_RATE;
               //    sample = (float32_t)sinf(2.0f * PI * 1000.0f * t);
           }
           // Apply Hann window
           fft_input[n] = sample * hann_window[n];
       }

       // 2) Real FFT
       arm_rfft_fast_f32(&S_rfft, fft_input, fft_output, 0);

       // 3) Compute power spectrum |X(k)|^2 for k in [0, num_fft_bins-1]
       power_spectrum[0] = fft_output[0] * fft_output[0];  // DC

       for (uint32_t k = 1; k < num_fft_bins - 1; k++)
       {
           float32_t re = fft_output[2 * k];
           float32_t im = fft_output[2 * k + 1];
           power_spectrum[k] = re * re + im * im;
       }

       // Nyquist (for even FFT_SIZE)
       float32_t re_nyq = fft_output[1];   // For arm_rfft_fast, nyquist might be at index 1
       power_spectrum[num_fft_bins - 1] = re_nyq * re_nyq;

       // 4) Apply Mel filter bank: mel_energies[m] = sum_k( power_spectrum[k] * H[m][k] )
       float32_t mel_energies[NUM_MEL_BANDS];
       for (uint32_t m = 0; m < NUM_MEL_BANDS; m++)
       {
           float32_t acc = 0.0f;
           for (uint32_t k = 0; k < num_fft_bins; k++)
           {
               acc += power_spectrum[k] * mel_filter_bank[m][k];
           }
           mel_energies[m] = acc;
       }

       // 5) Log-compression: log10(mel_energies + EPSILON)
       for (uint32_t m = 0; m < NUM_MEL_BANDS; m++)
       {
           float32_t e = mel_energies[m];
           if (e < EPSILON) e = EPSILON;
           mel_spectrogram[frame][m] = log10f(e);
       }
   }

   // 6) Optional: per‑matrix normalization to [0, 1]
   float32_t min_val = 1e30f;
   float32_t max_val = -1e30f;
   for (uint32_t t = 0; t < NUM_FRAMES; t++)
   {
       for (uint32_t m = 0; m < NUM_MEL_BANDS; m++)
       {
           float32_t v = mel_spectrogram[t][m];
           if (v < min_val) min_val = v;
           if (v > max_val) max_val = v;
       }
   }

   float32_t range = max_val - min_val;
   if (range < 1e-9f) range = 1.0f;

   for (uint32_t t = 0; t < NUM_FRAMES; t++)
   {
       for (uint32_t m = 0; m < NUM_MEL_BANDS; m++)
       {
           mel_spectrogram[t][m] =
               (mel_spectrogram[t][m] - min_val) / range;
       }
   }
}

void prepare_nn_input(float32_t *nn_input_1x32x32x1)
{
   // We want nn_input[h][w] = nn_input[mel][time]
   // mel_spectrogram is [time][mel] = [frame][mel]
   // So nn_input[mel][time] = mel_spectrogram[time][mel] (transpose)

   uint32_t idx = 0;
   for (uint32_t mel = 0; mel < NUM_MEL_BANDS; mel++)       // rows: frequency (Hz / mel)
   {
       for (uint32_t t = 0; t < NUM_FRAMES; t++)            // cols: time
       {
           nn_input_1x32x32x1[idx++] = mel_spectrogram[t][mel];
       }
   }
}
void send_mel_image_uart_print(void)
{
   // Format:
   // MEL32x32_START
   // row0_mel0_at_t0, row0_mel0_at_t1, ..., row0_mel0_at_t31
   // row1_mel1_at_t0, ...
   // ...
   // row31_mel31_at_t0, ..., row31_mel31_at_t31
   // MEL32x32_END

   printf("MEL32x32_START\n");

   for (uint32_t mel = 0; mel < NUM_MEL_BANDS; mel++)   // rows: frequency (Hz / mel)
   {
       for (uint32_t t = 0; t < NUM_FRAMES; t++)        // cols: time
       {
           // mel_spectrogram[time][mel]
           printf("%f", mel_spectrogram[t][mel]);
           if (t < NUM_FRAMES - 1)
           {
               printf(",");
           }
       }
       printf("\n");
   }

   printf("MEL32x32_END\n");
}
/* USER CODE END 0 */

/**
 * @brief  The application entry point.
 * @retval int
 */
int main(void)
{

 /* USER CODE BEGIN 1 */
 float32_t nn_input[32 * 32 * 1];
 /* USER CODE END 1 */

 /* MCU Configuration--------------------------------------------------------*/

 /* Reset of all peripherals, Initializes the Flash interface and the Systick. */
 HAL_Init();

 /* USER CODE BEGIN Init */

 /* USER CODE END Init */

 /* Configure the system clock */
 SystemClock_Config();

 /* USER CODE BEGIN SysInit */

 /* USER CODE END SysInit */

 /* Initialize all configured peripherals */
 MX_GPIO_Init();
 MX_USART1_UART_Init();
 /* USER CODE BEGIN 2 */
 // 1) Once at startup
 audio_mel_spectrogram_init();

 // 2) After filling audio_samples_16k with 1 s of audio
 compute_log_mel_spectrogram_32x32();

 // 3) Prepare input buffer for Cube.AI network
 prepare_nn_input(nn_input);
 send_mel_image_uart_print();
 /* USER CODE END 2 */

 /* Infinite loop */
 /* USER CODE BEGIN WHILE */
 while (1)
 {
   /* USER CODE END WHILE */

   /* USER CODE BEGIN 3 */
 }
 /* USER CODE END 3 */
}
Step 3: Visualizing with Python
Run this script to catch the UART stream on your PC and plot the spectrogram. Reset the IOT board and you’ll get it working.
					import serial
import numpy as np
import matplotlib.pyplot as plt

SERIAL_PORT = 'COM19'
BAUDRATE    = 115200
IMG_H = 32
IMG_W = 32
NUM_FLOATS = IMG_H * IMG_W

def read_mel_image_ascii_from_uart(port=SERIAL_PORT, baudrate=BAUDRATE):
   ser = serial.Serial(port, baudrate, timeout=5.0)

   # Wait for header
   while True:
       line = ser.readline().decode('ascii', errors='ignore').strip()
       if line == "MEL32x32_START":
           break

   # Read rows until END
   values = []
   while True:
       line = ser.readline().decode('ascii', errors='ignore').strip()
       if line == "MEL32x32_END":
           break
       if not line:
           continue

       # Split by comma, filter out empty entries
       parts = [p for p in line.split(',') if p.strip()]
       for p in parts:
           values.append(float(p))

   ser.close()

   if len(values) != NUM_FLOATS:
       raise RuntimeError(f"Expected {NUM_FLOATS} floats, got {len(values)}")

   arr = np.array(values, dtype=np.float32).reshape((IMG_H, IMG_W))
   return arr

def plot_mel_image(mel_image):
   # mel_image: shape (mel, time)
   plt.figure(figsize=(5, 5))
   plt.imshow(mel_image, origin='lower', aspect='auto', cmap='magma')
   plt.colorbar(label='Value')
   plt.title('Mel Image 32x32 from MCU (ASCII)')
   plt.xlabel('Time index')
   plt.ylabel('Mel bin index')
   plt.tight_layout()
   plt.show()

if __name__ == "__main__":
   img = read_mel_image_ascii_from_uart()
   print("Received mel_image_32x32 shape:", img.shape)
   plot_mel_image(img)
This script listens to the COM port, identifies the sync header, and plots the 32×32 matrix and if all goes well, considering the wav file used, this should be the output.
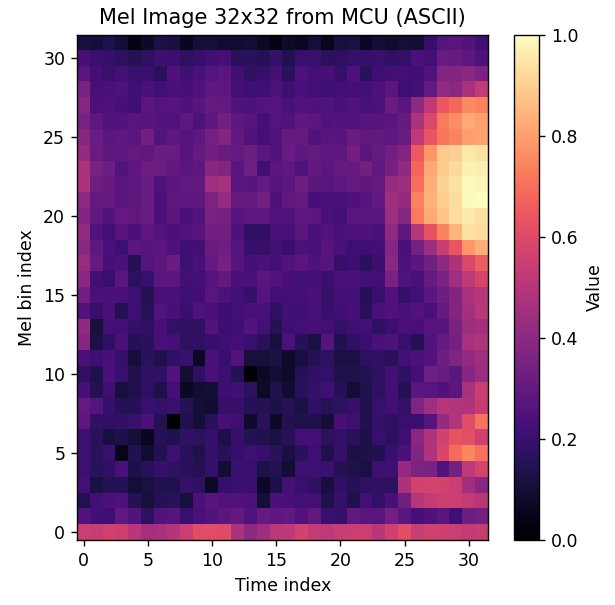
This confirms that we have a working code that can create the same 2D image used to train the audio recognition model.
Conclusion
Implementing the Mel-spectrogram on the STM32 is the ultimate test of an embedded AI engineer. By mirroring your Python preprocessing in C and verifying the output through UART visualization, you eliminate the “black box” of feature extraction. With the STM32’s and ARM’s specialized libraries, you can now run these complex transforms with ease, enabling high-performance, real-time audio intelligence at the edge.