Debug STM32 in VS Code Tutorial: getting to know the basics!
Abstract
Debugging STM32 in VS Code is easier than it may first appear. With the right combination of tools, you can set breakpoints, step through code, inspect variables, and even browse peripheral registers such as RCC and GPIO directly from the editor.
This article explains the essentials: the role of the GDB server, the difference between ST-LINK GDB Server and OpenOCD, how Quick Launch Debug helps you get started, why a proper launch.json matters, what the Cortex-Debug extension does, and how an SVD file makes STM32 register inspection much more useful.
1. Introduction
Why VS Code works well for STM32 debug
VS Code does not debug STM32 devices by itself. Instead, it connects several tools into one workflow:
VS Code -> Cortex-Debug -> arm-none-eabi-gdb -> GDB Server -> ST-LINK and finally your STM32 target.
Each layer has a role:
- VS Code provides the interface
- Cortex-Debug integrates embedded debugging into VS Code
- GDB is the debugger engine
- The GDB server talks to the probe and the target
- The SVD file describes peripheral registers
The result is the so sold “modern” debug experience with:
- source-level stepping
- breakpoints
- variable inspection
- memory and register views
- peripheral browsing by register name
2. GDB Server vs OpenOCD
A common misunderstanding is that GDB directly controls the STM32 target. In practice, GDB connects to a server process that handles hardware communication.
Two common choices are:
ST-LINK GDB Server
Best suited for:
- STM32 + ST-LINK
- quick setup
- STM32-focused workflows
Why use it:
- simple and effective for many STM32 projects
- natural fit in ST-centric environments
OpenOCD
Best suited for:
- mixed embedded environments
- automation and scripting
- teams using multiple probes or device families
Why use it:
- flexible
- widely used
- supports many targets and adapters
3. Quick Launch Debug: the fastest way to start
If you only want to verify that your board, toolchain, and probe are working, Quick Launch Debug is a good first step.
It helps confirm that:
- the ELF file is valid
- the STM32 target is reachable
- the probe is detected
- the debug server starts correctly
It is ideal for first bring-up, but not for long-term project use. Once debugging works, you usually want a checked-in and reusable launch.json.
3.1 launch.json: the real project setup
For a repeatable and shareable STM32 debug configuration, use a proper launch.json.
Here is a compact example using ST-LINK GDB Server:
The fields that matter most
type: must be cortex-debugexecutable: points to the .elf fileservertype: selects stlink or openocddevice: MCU namerunToEntryPoint: typically mainsvdFile: enables peripheral register decoding
3.2 Why Cortex-Debug is essential
The Cortex-Debug extension is what makes ARM Cortex-M debugging practical inside VS Code.
It provides:
- source-level debugging
- peripheral register views
- CPU register access
- memory browsing
- integration with GDB servers
- support for SVD-based peripheral trees
Without Cortex-Debug, VS Code would not provide the same integrated STM32 debug workflow.
3.3 The SVD file: the feature that changes everything
The SVD file describes the STM32 peripheral map in a structured way. It allows VS Code to show named peripherals and registers instead of raw addresses.
With the correct SVD file, you can browse entries such as:
and inspect registers such as:
If the SVD file is missing or incorrect, the debug session may still start, but the peripheral view will be incomplete or misleading.
4. Hands-on demo: inspect STM32 registers in VS Code
Using the previous article of the series> – Hacker Embedded STM32: How to create a Project with VS Code and STM32CubeIDE extension, perform the quick debug launch and:
4.1. Stop at main
Start the debug session and let it run to main.
4.2. Inspect initialization
Set breakpoints in:
mainMX_GPIO_Init()- the
HAL_GPIO_TogglePin() call
4.3. Check the hardware state
In the peripheral view:
- open
RCC - inspect
AHB1ENR - verify that the GPIOA clock enable bit is set
Then open GPIOA:
- inspect
MODER - confirm that PA5 is configured as output
- inspect
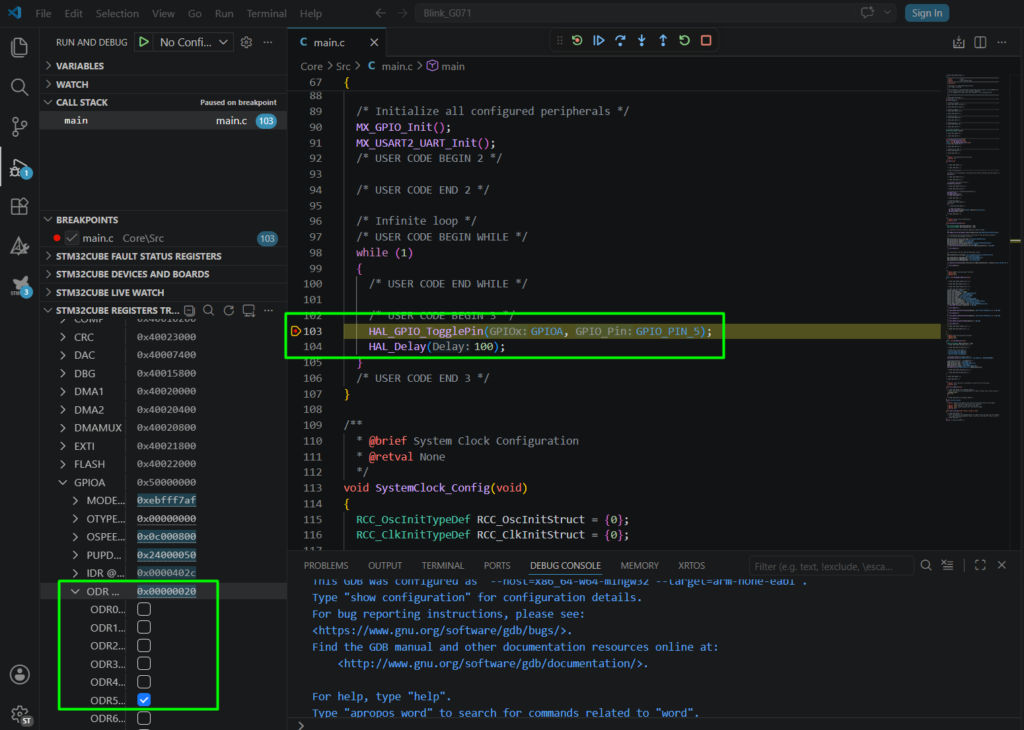
ODR - step over
HAL_GPIO_TogglePin() and watch the output bit change
This is the exact moment where source code and hardware state come together. You are no longer only stepping through C code, you are verifying what the STM32 peripheral registers are doing in real time.
5. Common Pitfalls
– Project not detected: Ensure CMake configuration is correct.
– Debug not starting: Verify debugger configuration and USB connection.
– Build errors: Confirm all toolchains are properly installed.
6. Conclusion
VS Code is a strong option for STM32 debugging when the setup is understood:
- Cortex-Debug integrates the workflow
- GDB performs the debugging
- ST-LINK GDB Server or OpenOCD connects to the hardware
launch.json makes the setup reusable- the SVD file makes peripheral registers readable and useful
For a quick first test, Quick Launch Debug is often enough. For day-to-day development, a proper launch.json is the better choice.