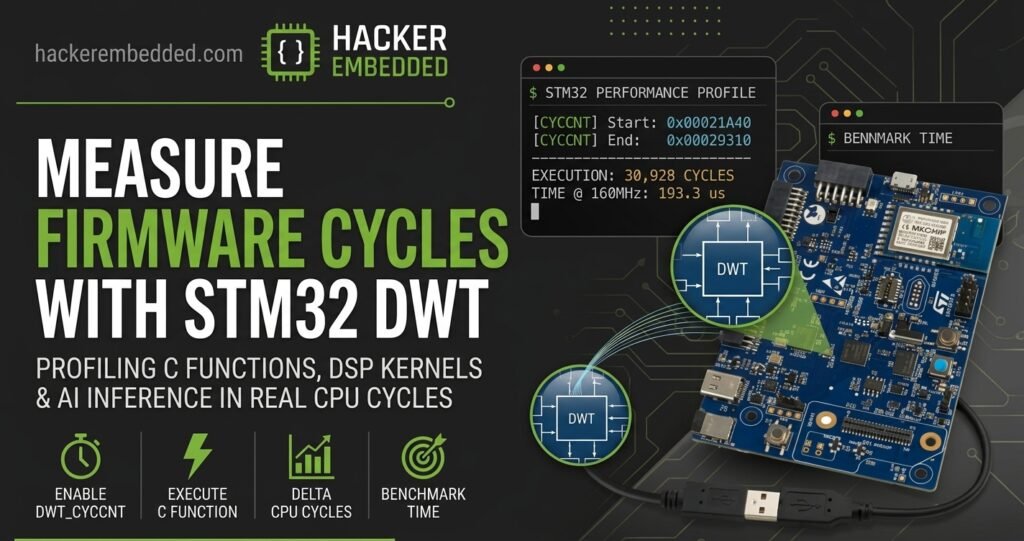
STM32 DWT Cycle Counter: Measure Your Firmware Performance
Using the Cortex-M Data Watchpoint and Trace Unit to Profile C Functions in CPU Cycles
When developing embedded firmware, one question eventually becomes unavoidable: how many CPU cycles does this function actually take?
You can toggle a GPIO and measure execution time with an oscilloscope. You can use a timer. You can use a logic analyzer. But if your STM32 uses a Cortex-M core, there is another extremely useful tool already inside the processor: the Data Watchpoint and Trace (DWT) unit. One of its registers, CYCCNT, can count CPU cycles.
This makes it possible to measure the execution time of C functions with very little instrumentation and without changing the behavior of the application significantly.
In this article, we will build a simple cycle counter, measure functions, convert cycles into time, and discuss the limitations of this technique.
1. What is the DWT?
The Data Watchpoint and Trace (DWT) is a debug and trace component available on many Arm Cortex-M processors. Among other features, the DWT contains a cycle counter register:
DWT->CYCCNT
CMSIS exposes this register through the DWT_Type structure. The same structure also provides counters for CPI, exceptions, sleep cycles, load/store operations and folded instructions. For performance measurements, however, CYCCNT is usually the most interesting one.
The basic idea is simple:
Read CYCCNT
     ↓
Execute code
     ↓
Read CYCCNT
     ↓
Subtract
     ↓
CPU cycles
2. Why Measure CPU Cycles?
Suppose you have an algorithm that processes sensor data. You could measure it with milliseconds:
Algorithm A: 0.42 ms
Algorithm B: 0.31 ms
But this number depends on the CPU clock. If your firmware runs at 80 MHz today and 160 MHz tomorrow, the execution time changes. CPU cycles provide a more fundamental measurement:
Algorithm A: 33,600 cycles
Algorithm B: 24,800 cycles
You can then convert cycles into time whenever you know the CPU frequency. This is particularly useful when comparing:
- Compiler optimization levels
- Different algorithms
- HAL vs LL implementations
- CMSIS-DSP functions
- Floating-point vs integer implementations
- AI inference functions
- Interrupt execution time
- DSP algorithms
- Communication routines
- RTOS critical sections
3. Enabling the DWT Cycle Counter
A simple initialization function is enough on Cortex-M devices that expose the required DWT functionality:
static void DWT_Init(void)
{
    CoreDebug->DEMCR |= CoreDebug_DEMCR_TRCENA_Msk;

    DWT->CYCCNT = 0;

    DWT->CTRL |= DWT_CTRL_CYCCNTENA_Msk;
}
The first line enables the trace/debug block. The second resets the cycle counter. The third enables the cycle counter. Then:
uint32_t start = DWT->CYCCNT;

/* Code to measure */

uint32_t end = DWT->CYCCNT;

uint32_t cycles = end - start;
That's it.
4. Measuring a Function
Let's start with a simple function:
static uint32_t CalculateSum(uint32_t *data, uint32_t length)
{
    uint32_t sum = 0;

    for (uint32_t i = 0; i < length; i++)
    {
        sum += data[i];
    }

    return sum;
}
We can measure it like this:
uint32_t start;
uint32_t end;
uint32_t cycles;

start = DWT->CYCCNT;

volatile uint32_t result =
    CalculateSum(data, 100);

end = DWT->CYCCNT;

cycles = end - start;
The volatile qualifier is useful here because otherwise the compiler may determine that the result is never used and optimize the entire operation away.
5. Converting Cycles into Time
Suppose your CPU runs at 160 MHz — that means 160,000,000 cycles/second. One cycle takes 1 / 160,000,000, or 6.25 ns. Therefore:
time_ns =
    (cycles * 1000000000ULL) /
    SystemCoreClock;
For example, 10,000 cycles at 160 MHz corresponds to 62.5 µs.
6. A Reusable Measurement Function
You can create a small helper:
static inline uint32_t DWT_GetCycles(void)
{
    return DWT->CYCCNT;
}
Then:
uint32_t start = DWT_GetCycles();

MyAlgorithm();

uint32_t elapsed = DWT_GetCycles() - start;
For larger projects, you can create a small performance measurement module. For example:
typedef struct
{
    uint32_t start;
    uint32_t end;
    uint32_t cycles;
} PerfMeasurement_t;

static inline void Perf_Start(PerfMeasurement_t *m)
{
    m->start = DWT->CYCCNT;
}

static inline void Perf_Stop(PerfMeasurement_t *m)
{
    m->end = DWT->CYCCNT;
    m->cycles = m->end - m->start;
}
Usage:
PerfMeasurement_t measurement;

Perf_Start(&measurement);

MyAlgorithm();

Perf_Stop(&measurement);

printf("Cycles = %lu\r\n",
       measurement.cycles);
7. Measuring a DSP Algorithm
This becomes especially interesting with CMSIS-DSP. For example:
arm_rfft_fast_f32(
    &fft_instance,
    input,
    output,
    0
);
You can measure the FFT directly:
uint32_t start = DWT->CYCCNT;

arm_rfft_fast_f32(
    &fft_instance,
    input,
    output,
    0
);

uint32_t cycles =
    DWT->CYCCNT - start;
Now you have an objective way to compare FFT implementation, compiler optimization, CPU frequency, data size, and floating-point configuration — much more useful than simply saying "the FFT seems fast."
8. Measuring AI Inference
The same technique can be used for embedded AI. For example:
uint32_t start = DWT->CYCCNT;

ai_run(input_data, output_data);

uint32_t cycles =
    DWT->CYCCNT - start;
You can then compare an FP32 model, an INT8 model, an optimized model, different compiler settings, and different STM32 families. This is exactly the type of measurement that turns an AI demo into an engineering benchmark.
9. Don't Measure Only Once
This is one of the most important points. Never assume that one measurement represents the real execution time. Run the function many times. For example:
uint32_t min = UINT32_MAX;
uint32_t max = 0;
uint64_t total = 0;

for (uint32_t i = 0; i < 1000; i++)
{
    uint32_t start = DWT->CYCCNT;

    MyAlgorithm();

    uint32_t cycles =
        DWT->CYCCNT - start;

    if (cycles < min)
        min = cycles;

    if (cycles > max)
        max = cycles;

    total += cycles;
}

uint32_t average =
    total / 1000;
Now you can report:
Minimum:  2,840 cycles
Average:  2,913 cycles
Maximum:  3,201 cycles
This is much more useful.
10. Why Can the Results Vary?
Several factors can affect execution time:
| Factor | Mitigation for a Controlled Benchmark |
|---|---|
| Interrupts | Disable unnecessary interrupts |
| RTOS scheduling | Run the same input repeatedly |
| Cache behavior | Use the same compiler configuration |
| Memory wait states | Use the same clock configuration |
| Flash configuration, branch prediction, DMA activity, bus contention | Run enough iterations |
11. Beware of Counter Overflow
CYCCNT is a 32-bit counter. At 160 MHz:
2^32 / 160,000,000 ≈ 26.8 seconds
So the counter will eventually wrap around. Fortunately, unsigned subtraction works correctly for measurements shorter than one full counter period:
elapsed = end - start;
This is another reason to keep individual measurements reasonably short.
12. DWT versus GPIO Measurement
A GPIO measurement is still extremely valuable. For example:
GPIO_Set();
MyFunction();
GPIO_Clear();
Then use an oscilloscope or logic analyzer. The advantage is that the measurement includes the real external timing behavior. DWT has another advantage: you can measure code that is difficult to expose through a GPIO — function calls, small loops, interrupt handlers, DSP kernels, AI operators, and RTOS operations. A good embedded engineer should know both techniques.
13. A Practical Benchmark Strategy
For Hacker Embedded projects, I recommend using a three-level strategy:
| Level | Tool | Question Answered |
|---|---|---|
| Level 1 | DWT | How many cycles? |
| Level 2 | GPIO | How long is the real pulse? |
| Level 3 | Trace / profiling tools | Where is the CPU spending its time? |
14. Conclusion
The Cortex-M DWT is one of those features that is easy to overlook because it is not part of the normal application code. But DWT->CYCCNT can become an extremely useful tool for embedded development.
With only a few lines of code, you can measure:
- CPU cycles
- Function execution time
- DSP performance
- Interrupt latency
- AI inference time
- Optimization improvements
Related Articles & Resources
- STM32U5 Audio Prep for AI: Implementing Real-Time Mel-Spectrograms with CMSIS-DSP
- Baby Steps into TinyML: Your First Embedded AI Project on STM32
- TinyML Lab: Simple MLP + PCA for STM32 TinyML Deployment with X-Cube-AI Cloud
- How to Debug STM32 in VS Code
- CMAKE Preset and Optimization Levels in VS Code with STM32CubeIDE Extension
- STM32 FreeRTOS Mutex: Protecting Resources